
Research · Injury data
Power tool injury statistics (US, 2015–2024)
About 195,900 injuries involving power tools were treated in US hospital emergency departments in 2024, according to an AccessoryFit analysis of the Consumer Product Safety Commission's NEISS injury data (confidence interval 164,444 to 227,357 injuries). Workshop grinders, chain saws and table saws are the three largest tool groups, fingers account for 44.2% of injuries, and 4.2% of cases were amputations. The 2024 figure is the highest since 2015, but the change sits inside the statistical margin of error.
By AccessoryFit editors · Checked
On this page
- What are the key findings?
- How many power tool injuries are there in the US each year?
- Which power tools cause the most ER visits?
- Why are jigsaws and reciprocating saws not ranked?
- Which body parts are injured most by power tools?
- What kinds of injury are they?
- Who gets hurt by power tools?
- How many power tool injuries are amputations?
- Do most power tool injuries happen at home?
- How many power tool injuries need a hospital stay?
- Are power tool injuries increasing?
- What do these figures mean for choosing and fitting accessories?
- How was this data produced?
- How to cite this data
What are the key findings?
- About 195,900 injuries involving power tools were treated in US emergency departments in 2024 (confidence interval 164,444 to 227,357 injuries), based on CPSC NEISS data.
- Workshop grinders, buffers and polishers were involved in about 40,000 injuries in the US in 2024, the highest point estimate of any tool group in the data.
- Chain saws (about 33,600 injuries) and table and bench saws (about 33,100 injuries) came next among US emergency department visits in 2024, with confidence intervals that overlap each other and the grinder estimate.
- In 2024, 4.2% of US emergency department injuries involving power tools were diagnosed as amputations, rising to 10.9% for table and bench saws and 10.8% for portable circular saws.
- Fingers were the body part injured in 44.2% of US emergency department injuries involving power tools in 2024, and 85.5% of table and bench saw injuries were to the fingers.
- Drills and drill accessories were involved in about 23,600 injuries treated in US emergency departments in 2024, 41.7% of them to the fingers.
- Men made up 94.0% of people treated for power tool injuries in US emergency departments in 2024, and people aged 65 and over 24.1%.
- The 2024 US total is the highest estimate since 2015, but its confidence interval overlaps the 2023 interval and CPSC was moving NEISS to a redesigned hospital sample, so the data do not show a confirmed rise.
All figures are national estimates from a hospital sample, not counts of individual cases.
How many power tool injuries are there in the US each year?
In 2024 an estimated 195,900 injuries involving power tools were treated in US emergency departments, with a confidence interval of 164,444 to 227,357 injuries. The year-by-year estimates since 2015, each with its own interval, are in the trend table further down this page.
This total covers the tool groups in the table below, and it includes chain saws (about 33,600 injuries) and nail guns and stud drivers (about 9,100 injuries). Some writers will want a total without those two groups. That narrower total has not been computed here: a NEISS case can name two products, so subtracting rows would not give a correct national estimate or confidence interval. It needs re-running on case-level data.
Injuries treated outside emergency departments are not in NEISS. For work injuries, a 2026 NIOSH analysis in the Journal of Safety Research estimated that tools, instruments and equipment were the source of about 3,013,000 injuries at work treated in US emergency departments from 2012 to 2023 (a broader category than power tools), and noted that NEISS-Work collection ended after 2023.
Which power tools cause the most ER visits?
Workshop grinders, buffers and polishers were involved in the most US emergency department visits in 2024, about 40,000 injuries, followed by chain saws (33,600 injuries) and table and bench saws (33,100 injuries). Those three estimates have overlapping confidence intervals, so the fairest reading is that they are the three largest groups, not a strict first, second and third. Drills and drill accessories (23,600 injuries) form the next tier, ahead of portable circular saws (9,500 injuries).
Two large rows hold cases where the record names a saw but not its type, so the named-saw rows are best read as lower bounds. Miter saws have no product code of their own in NEISS at all, so they cannot be counted separately.
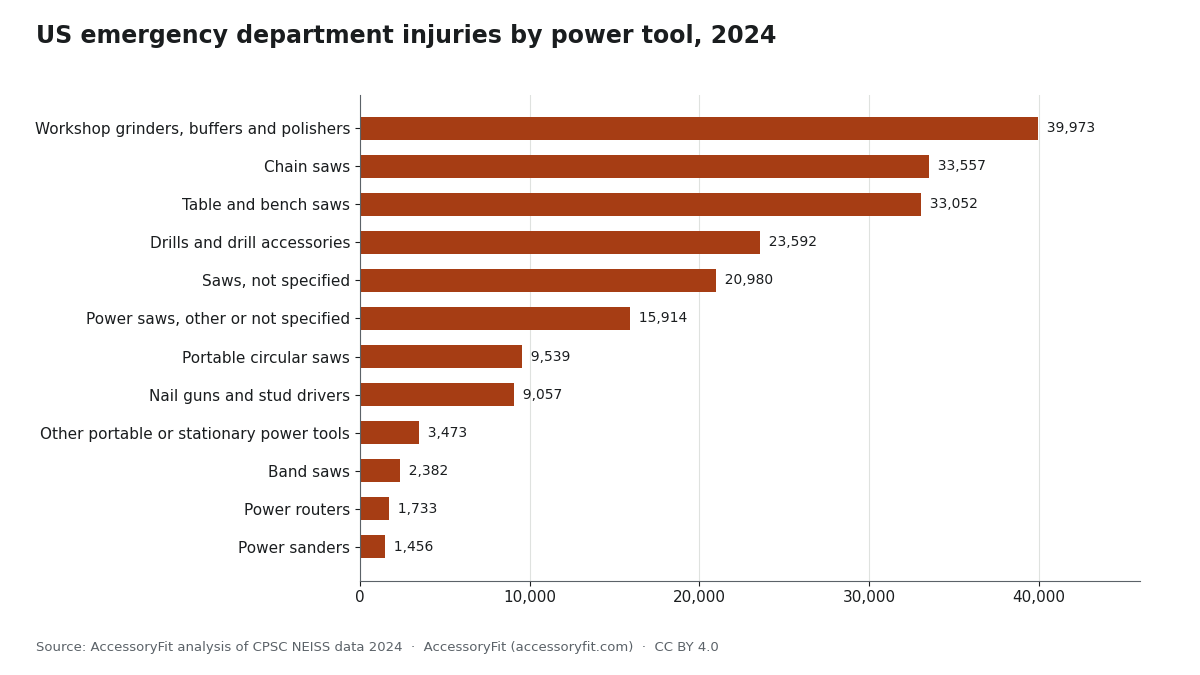
| Tool | Estimated injuries | 95% confidence interval | Amputation share | Sampled cases | Reliability |
|---|---|---|---|---|---|
| Workshop grinders, buffers and polishers | 39,973 | 31,899–48,047 | 0.3% | 642 | reliable |
| Chain saws | 33,557 | 26,525–40,588 | 1.0% | 534 | reliable |
| Table and bench saws | 33,052 | 26,514–39,590 | 10.9% | 560 | reliable |
| Drills and drill accessories | 23,592 | 18,993–28,190 | 1.7% | 409 | reliable |
| Saws, not specified | 20,980 | 16,350–25,611 | 3.9% | 370 | reliable |
| Power saws, other or not specified | 15,914 | 12,769–19,059 | 9.1% | 276 | reliable |
| Portable circular saws | 9,539 | 6,744–12,333 | 10.8% | 172 | reliable |
| Nail guns and stud drivers | 9,057 | 6,568–11,546 | 0.0% | 154 | reliable |
| Other portable or stationary power tools | 3,473 | 2,416–4,530 | 3.9% | 63 | reliable |
| Band saws | 2,382 | 1,547–3,217 | 6.5% | 44 | reliable |
| Power routers | 1,733 | 1,084–2,382 | 4.5% | 29 | reliable |
| Power sanders | 1,456 | 703–2,209 | 0.0% | 23 | reliable |
| Sabre (reciprocating) saws | 1,198 | 418–1,978 | 0.0% | 18 | unreliable (small sample) |
| Jigsaws | 590 | 190–991 | 0.0% | 11 | unreliable (small sample) |
| Radial arm saws | 213 | 0–502 | 0.0% | 2 | unreliable (small sample) |
Tools can be counted in more than one row when a case names two products. Unreliable rows should not be quoted as estimates.
Why are jigsaws and reciprocating saws not ranked?
Jigsaws, sabre (reciprocating) saws and radial arm saws are listed in the table but marked unreliable, because each rests on too few sampled cases in 2024 to support a national estimate. Those rows should not be quoted as figures. Power sanders and routers pass the thresholds but sit close to them, so their confidence intervals are wide. For the bigger groups there are dedicated pages with more detail: table saw injury data covers trends, body parts and guard findings for bench saws, and the grinder injury data page breaks down eye and hand injuries from grinders.
Which body parts are injured most by power tools?
Fingers were the body part injured in 44.2% of power tool cases in the 2024 US emergency department data, followed by the eyeball (14.3%) and the hand (12.0%). The pattern changes sharply by tool. On table and bench saws, 85.5% of injuries were to the fingers, and on drills it was 41.7%. Grinders are the exception: the eyeball is the most commonly recorded body part (48.3% of grinder cases), which fits the way grinding throws off sparks, chips and wheel fragments.
| Diagnosis | Estimated injuries | Share |
|---|---|---|
| Laceration | 108,116 | 55.2% |
| Foreign body | 21,763 | 11.1% |
| Fracture | 16,633 | 8.5% |
| Contusions, abr. | 11,229 | 5.7% |
| Puncture | 8,596 | 4.4% |
| Other | 8,401 | 4.3% |
| Amputation | 8,138 | 4.2% |
| Avulsion | 3,920 | 2.0% |
| Strain, sprain | 2,442 | 1.2% |
| Internal injury | 2,225 | 1.1% |
Only categories meeting CPSC reliability thresholds are shown, so shares may not add to 100%.
What kinds of injury are they?
Lacerations made up 55.2% of power tool injuries in the 2024 US data, followed by foreign bodies (11.1%) and fractures (8.5%). Amputations are a small share of the total but the most serious outcome, and they are concentrated on saws.
Who gets hurt by power tools?
Men made up 94.0% of people treated in US emergency departments for power tool injuries in 2024, and the largest age group was adults aged 35 to 54 (33.4%). The second-largest group was people aged 65 and over (24.1%), ahead of younger adults, which runs against the common picture of power tool injuries as a young tradesperson's problem.
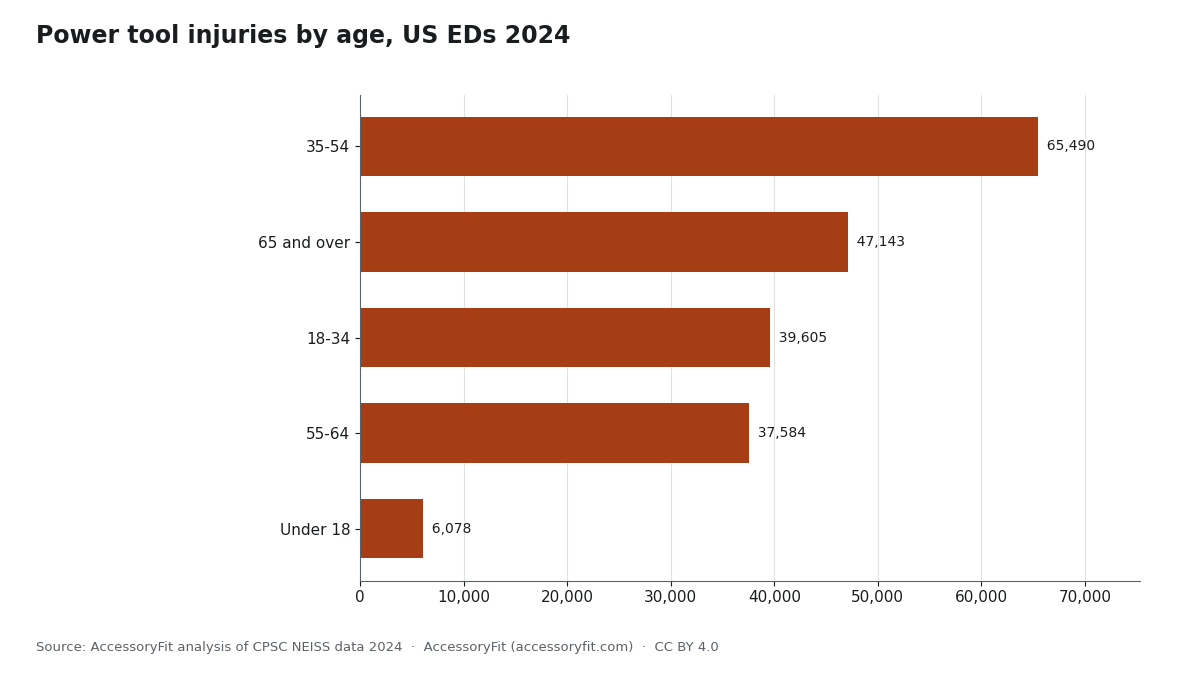
| Age band | Estimated injuries | Share |
|---|---|---|
| 35-54 | 65,490 | 33.4% |
| 65 and over | 47,143 | 24.1% |
| 18-34 | 39,605 | 20.2% |
| 55-64 | 37,584 | 19.2% |
| Under 18 | 6,078 | 3.1% |
Only categories meeting CPSC reliability thresholds are shown, so shares may not add to 100%.
| Sex | Estimated injuries | Share |
|---|---|---|
| Male | 184,148 | 94.0% |
| Female | 11,674 | 6.0% |
Only categories meeting CPSC reliability thresholds are shown, so shares may not add to 100%.
How many power tool injuries are amputations?
In 2024, 4.2% of US emergency department injuries involving power tools were diagnosed as amputations; the estimated number is in the diagnosis table above and in the CSV. Saws dominate. The amputation share was 10.9% for table and bench saws, 10.8% for portable circular saws and 6.5% for band saws, compared with 1.7% for drills and 0.3% for grinders.
Two peer-reviewed studies of NEISS data put this in a longer frame. Renfro and colleagues, writing in the journal Hand about US emergency-treated finger amputations from 2010 to 2019, found power saws were the leading product, at 28.2% of all cases. Monir and colleagues, also in Hand, studied upper-limb saw injuries from 2003 to 2022: amputations made up 9.9% of cases and showed no significant decline over the period, even though saw injuries overall fell. Their figures cover arm and hand injuries from saws only, not all power tools.
Do most power tool injuries happen at home?
Home is the most common recorded location for power tool injuries in the 2024 data (37.0% of cases), but for the rest the location was mostly not recorded at all, so the data cannot say what share happen at home. The location table shows the unknown group is larger than every known location combined. A claim that most injuries happen at home goes beyond what NEISS shows.
| Location | Estimated injuries | Share |
|---|---|---|
| Unk | 119,262 | 60.9% |
| Home | 72,577 | 37.0% |
| Public | 1,757 | 0.9% |
| School | 1,355 | 0.7% |
Only categories meeting CPSC reliability thresholds are shown, so shares may not add to 100%.
How many power tool injuries need a hospital stay?
In 2024, 91.4% of people seen in US emergency departments for power tool injuries were treated and released the same day; 4.5% were admitted and 2.3% transferred to another hospital.
| Disposition | Estimated injuries | Share |
|---|---|---|
| Treated/examined and released | 179,003 | 91.4% |
| Treated and admitted/hospitalized | 8,777 | 4.5% |
| Treated and transferred | 4,554 | 2.3% |
| Left without being seen | 2,605 | 1.3% |
Only categories meeting CPSC reliability thresholds are shown, so shares may not add to 100%.
Are power tool injuries increasing?
The 2024 US estimate of 195,900 injuries is the highest in the 2015 to 2024 series, but the data do not show a confirmed increase. Its confidence interval, 164,444 to 227,357 injuries, overlaps the 2023 interval and those of several earlier years. On top of that, CPSC announced in 2021 that NEISS was moving to a redesigned hospital sample, and if recruitment ran late, 2023 estimates would come from the old sample and 2024 estimates from the new one. The public files are not adjusted for that switch, so a jump between those two years may partly reflect which hospitals are in the sample.
Over the longer run the picture is broadly flat, with a dip in 2021 and 2022. Next year's NEISS release, on the same new sample, will show whether the 2024 level holds.
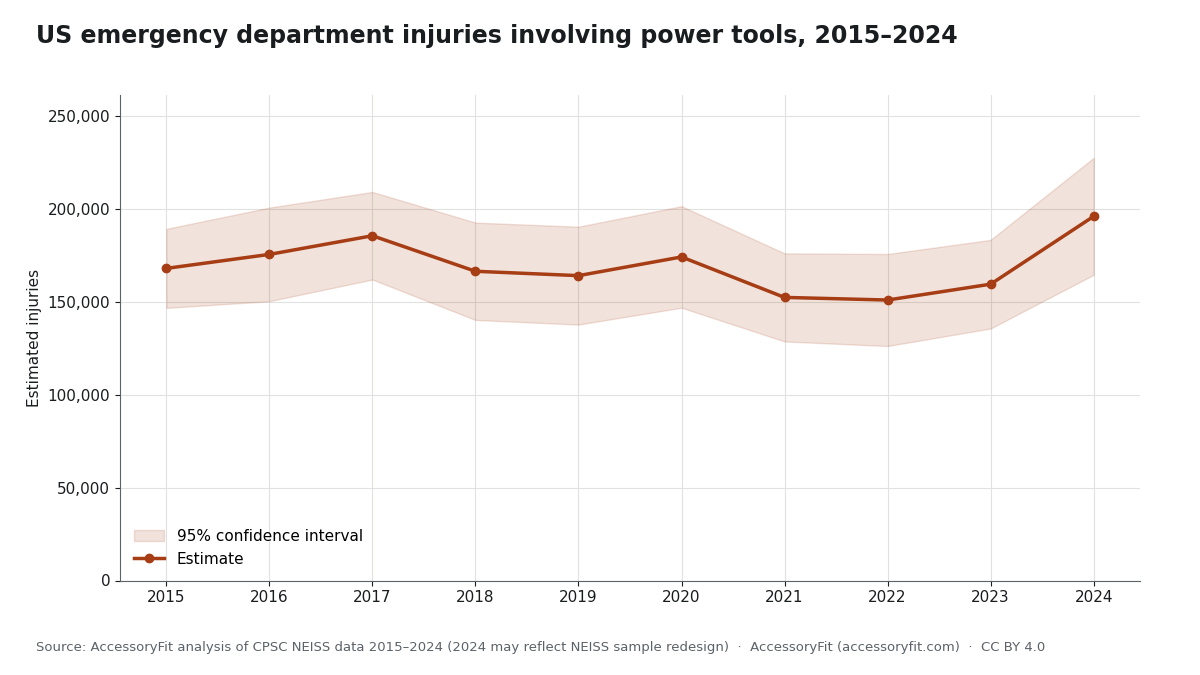
| Year | Estimated injuries | 95% confidence interval | Amputation share | Reliability |
|---|---|---|---|---|
| 2015 | 167,913 | 146,649–189,178 | 4.7% | reliable |
| 2016 | 175,442 | 150,263–200,622 | 4.5% | reliable |
| 2017 | 185,476 | 161,917–209,034 | 4.6% | reliable |
| 2018 | 166,354 | 140,164–192,544 | 4.9% | reliable |
| 2019 | 164,010 | 137,682–190,337 | 4.7% | reliable |
| 2020 | 174,066 | 146,758–201,375 | 4.9% | reliable |
| 2021 | 152,301 | 128,614–175,988 | 4.6% | reliable |
| 2022 | 150,892 | 126,142–175,642 | 4.0% | reliable |
| 2023 | 159,415 | 135,578–183,253 | 4.2% | reliable |
| 2024 | 195,901 | 164,444–227,357 | 4.2% | reliable |
CPSC's 2021 notice says NEISS was moving to a redesigned hospital sample, with 2024 estimates possibly the first from the new sample, so treat the 2023-to-2024 change with care.
What do these figures mean for choosing and fitting accessories?
The data say which tools and body parts are involved, not what caused each injury, but several patterns line up with accessory fitting checks. Saws carry the highest amputation shares, and a blade must match the saw's arbor, diameter and speed rating; the guide to circular saw arbor sizes covers those three checks, and the guide on choosing a circular saw blade covers tooth count and kerf. Grinders lead on eye injuries, which is a reminder to use the guard and wheel type the grinder's maker specifies; see grinder disc sizes and arbors. Drill injuries are mostly to the fingers and hands; the guide to drill chuck sizes covers which shanks each chuck is made to hold.
A common belief is that an accessory which physically fits a tool is safe to use. Makita's guidance says otherwise: the accessory's rated speed and size must also suit the tool.
How was this data produced?
Source. The figures come from the Consumer Product Safety Commission's National Electronic Injury Surveillance System (NEISS), a probability sample of US hospitals with emergency departments. Each sampled case carries a statistical weight; AccessoryFit downloaded the public case files for 2015 to 2024 and summed those weights to produce national estimates. Product codes used: table and bench saws (841), portable circular saws (832), band saws (842), radial arm saws (843), saws not specified (845), power saws other or not specified (895), jigsaws (875), sabre saws (864), chain saws (1411), drills and drill accessories (847, 855, 856, 871), workshop grinders, buffers and polishers (897, 898, 899), power sanders (803), routers (804), nail guns and stud drivers (882) and other power tools (809).
Uncertainty. Confidence intervals are 95% intervals from a with-replacement variance estimate across NEISS strata and hospitals. Following CPSC's own publication rules, any estimate based on fewer than 20 sampled cases, under 1,200 estimated injuries, or with a coefficient of variation above 33% is marked unreliable and should not be quoted. Breakdown tables show only categories that pass those thresholds, so shares may not sum to the total.
Limitations.
- NEISS records products involved in an injury, not that the tool or accessory caused it.
- A case can name two products, so tool rows can overlap and do not sum exactly to the all-tools total.
- Only emergency department visits are counted. Urgent care, doctors' offices and on-site first aid are excluded, so the true number of injuries is higher.
- The grinder group combines NEISS codes for workshop grinders, buffers and polishers, so bench grinders and buffers sit in the same rows as angle grinders and cannot be separated.
- Location is not recorded for most cases, so home and work shares cannot be estimated reliably.
- The NEISS hospital sample was redesigned around 2023 to 2024 and the public files are not backcast, so year-to-year comparisons across that point are indicative only, and a change is only meaningful where the confidence intervals do not overlap.
- Single-study figures (Renfro; Monir; NIOSH) use their own definitions and years.
The wider sourcing and correction rules behind every AccessoryFit page are on the methodology page.
How to cite this data
Suggested citation: AccessoryFit, "Power tool injury statistics (US, 2015–2024)", updated 22 October 2026, https://accessoryfit.com/research/power-tool-injury-statistics/. Please also name the underlying source as CPSC NEISS.
The data, tables and charts on this page are free to reuse, including commercially, under the Creative Commons Attribution 4.0 licence (CC BY 4.0), on condition of credit with a link to this page. If you spot an error or need a breakdown that is not here, the power tool research and data hub lists the other datasets and how to get in touch.
Download the data
Spreadsheet-ready CSV files and full-size chart images. The yearly file gives sampled cases, national estimate, confidence interval, coefficient of variation and a reliability flag for every row; the 2024 detail file gives estimates, shares and reliability flags.
- Power tool injuries by tool and year, 2015–2024 (CSV) National estimates, confidence intervals and amputation estimates for each tool group and year.
- 2024 breakdowns by body part, diagnosis, age, sex, location and disposition (CSV) One row per tool group, dimension and category, with share and reliability flag.
- Chart: injuries by tool, 2024 (PNG) 1200 × 675 bar chart.
- Chart: trend 2015–2024 with confidence band (PNG) 1200 × 675 line chart.
- Chart: injuries by age band, 2024 (PNG) 1200 × 675 bar chart.
Questions readers ask
Which power tool causes the most injuries in the US?
Workshop grinders, buffers and polishers were involved in the most US emergency department visits in 2024, about 40,000 injuries. Chain saws and table and bench saws were close behind, with overlapping confidence intervals, so the three are best described as the largest groups together.
Which power tool causes the most amputations?
Table and bench saws. In 2024, 10.9% of their US emergency department injuries were amputations, and they are the largest saw group by volume. Portable circular saws had a similar share, 10.8%, on a smaller number of injuries.
Does the total include chain saws and nail guns?
Yes. The all-tools total of about 195,900 injuries includes chain saws and nail guns and stud drivers. A total without them has not been computed, because overlapping cases mean the rows cannot simply be subtracted.
Are miter saw injuries included?
Yes, but they cannot be separated out. NEISS has no product code for miter saws, so those cases fall under the saws-not-specified and power-saws-other rows, which are part of the all-tools total.
Why is the 2024 figure higher than 2023?
The data cannot say for certain. The two years' confidence intervals overlap, so the difference is not statistically clear, and NEISS moved to a redesigned hospital sample around that time, which can shift estimates on its own.
Where to go next
- Table saw injury statisticsTrends, body parts and guard findings for bench saws.
- Angle grinder injury statisticsEye and hand injuries from grinders in detail.
- Circular saw blade arbor sizeThe three checks for a blade that fits.
- Power tool research and dataAll AccessoryFit datasets and free resources.
References 34 documents, 12 publishers
- BG BAU - Berufsgenossenschaft der Bauwirtschaft (Germany): Baustellenkreissaegen, Handkreissaegen - Baustein B 265
- Bosch: 1617/1618 router operating/safety instructions (2610051825)
- DeWalt: DWE575 circular saw instruction manual (N786997)
- Freud and Diablo: Get the most out of your Freud bits by routing at ideal feed rates and speeds
- Hand (N Y): Traumatic Finger Amputations: Epidemiology and Mechanism of Injury, 2010-2019; Trends in Upper Extremity Saw Injuries From 2003 to 2022
- Health and Safety Executive (UK): Circular saw benches - Safe working practices, Woodworking Information Sheet No 16 (Revision 2)
- Journal of Clinical Orthopaedics and Trauma: Patients admitted for treatment of traumatic finger amputations: Characteristics, causes, and prevention
- Makita: 9557PB angle grinder instruction manual; 5007F 7-1/4 in circular saw instruction manual
- Milwaukee Tool: M18 FUEL oscillating multi-tool 2836-20 operator's manual (58-14-0217d1)
- NIOSH: Nonfatal work-related injuries treated in hospital emergency departments in the U.S., 2012-2023
- OSHA: 29 CFR 1910.215 Abrasive wheel machinery; 29 CFR 1910.243 Guarding of portable powered tools; 29 CFR 1926.303 Abrasive wheels and tools; 29 CFR 1926.300 General requirements (Tools, hand and power); 29 CFR 1926.304 Woodworking tools
- U.S. Consumer Product Safety Commission: NEISS 2024 data file (neiss2024.xlsx); Safety Standard Addressing Blade-Contact Injuries on Table Saws: Supplemental Notice of Proposed Rulemaking (November 1, 2023); The 2017 NEISS Table Saw Special Study (staff briefing package, including Table Saw Blade-Contact Injuries Special Study Report, 2017); Proposed Rule: Safety Standard Addressing Blade-Contact Injuries on Table Saws (staff briefing package, January 17, 2017); Injuries Associated with Stationary Power Saws, 2001; 2019 NEISS Coding Manual; Withdrawal of Proposed Regulatory Actions (September 29, 2025); NEISS 2015 data file (neiss2015.xlsx); NEISS 2016 data file (neiss2016.xlsx); NEISS 2017 data file (neiss2017.xlsx); NEISS 2018 data file (neiss2018.xlsx); NEISS 2019 data file (neiss2019.xlsx); NEISS 2020 data file (neiss2020.xlsx); NEISS 2021 data file (neiss2021.xlsx); NEISS 2022 data file (neiss2022.xlsx); NEISS 2023 data file (neiss2023.xlsx); Agency Information Collection Activities; Follow-Up Activities for Product-Related Injuries Including NEISS (Docket CPSC-2009-0102), FR Doc. 2021-23302
Accessed .